Municipal Profile
Municipal Profile
Quezon is a fifth-class municipality in the province of Quezon, Region IV-A CALABARZON. The municipality is bounded by the Pacific Ocean on the north, west, and Lamon Bay on the east and south. It is one of the three municipalities located in Alabat Island which is also locally known as the Alabat Island composed of Alabat, Quezon, and Perez. The municipality of Lopez and Gumaca is separated by Lamon Bay. Quezon is 82 kilometers away from Lucena City, the provincial capital and about 217 kilometers away from Manila City. Map 1 shows the location map of the municipality of Quezon.
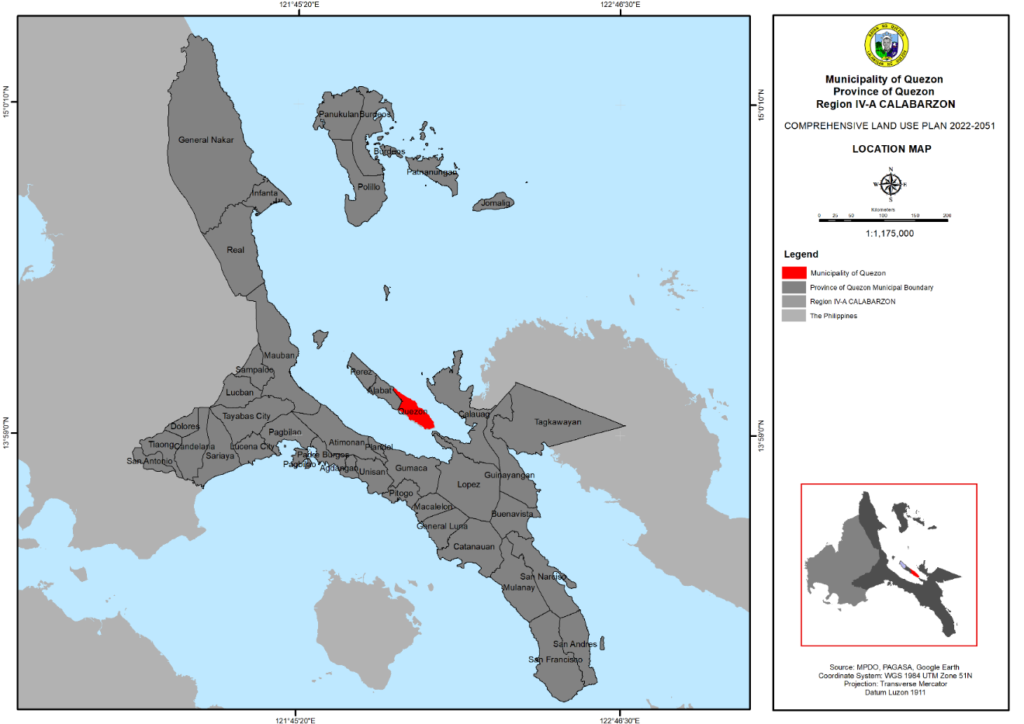
Map 1. Location Map of Quezon, Quezon.
1. Physical Environment
- Topography
The land area of the municipality of Quezon is 7,122 hectares based on the cadastral map, composed of 24 barangays (Map RM-2). There are six urban barangays also as the urban barangays: Poblacion I, Poblacion II, Poblacion III, Poblacion IV, Poblacion V, and Poblacion VI. The rural barangays are located in the Lamon Bay area are barangays Cagbalogo, Tagkawa, Caridad, Cometa, Magsino, Apad, Guinhawa, Montaña, and Mascariña while on the Pacific side are barangays Silangan, Gumubat, Villa Mercedes, Villa Francia, Argosino, Villa Belen, Villa Gomez, Del Pilar and Sabang.
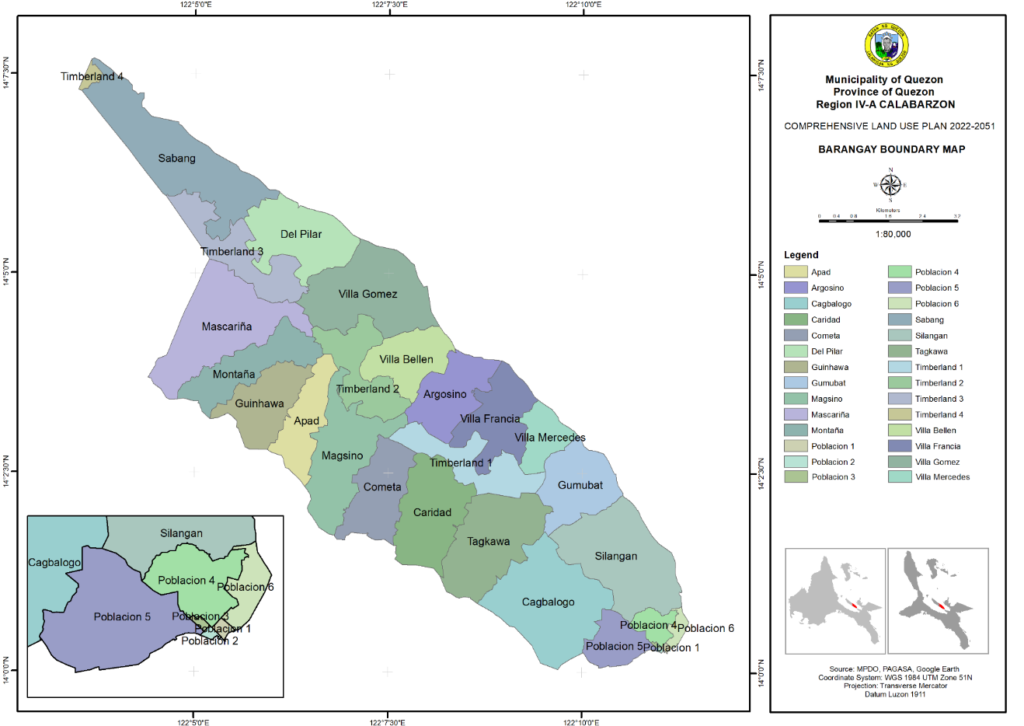
Map 2. Barangay Boundary Map of Quezon, Quezon
- Geo-Hazard Mapping
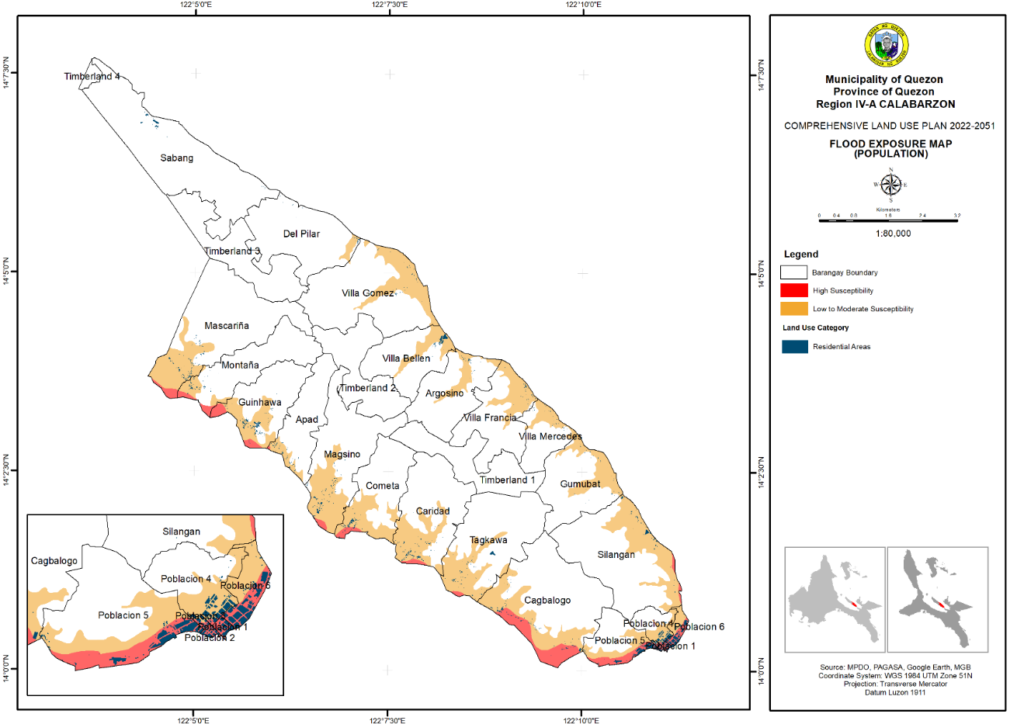
Map 3. Flood Exposure Map of Population in Quezon, Quezon
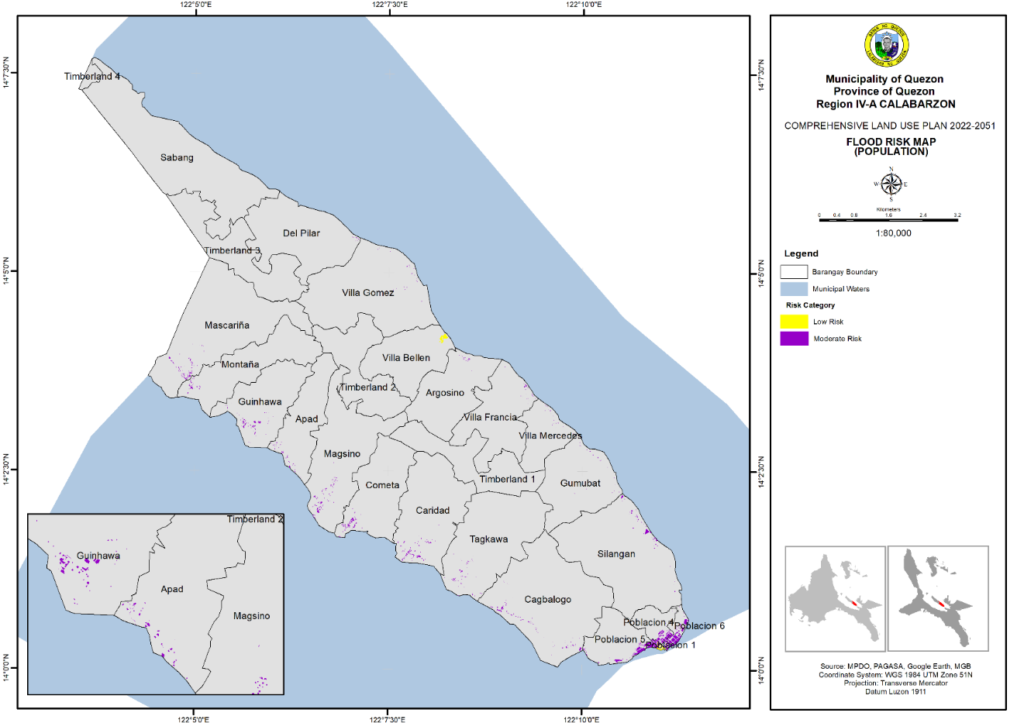
Map 4. Flood Risk Map of Population in Quezon, Quezon
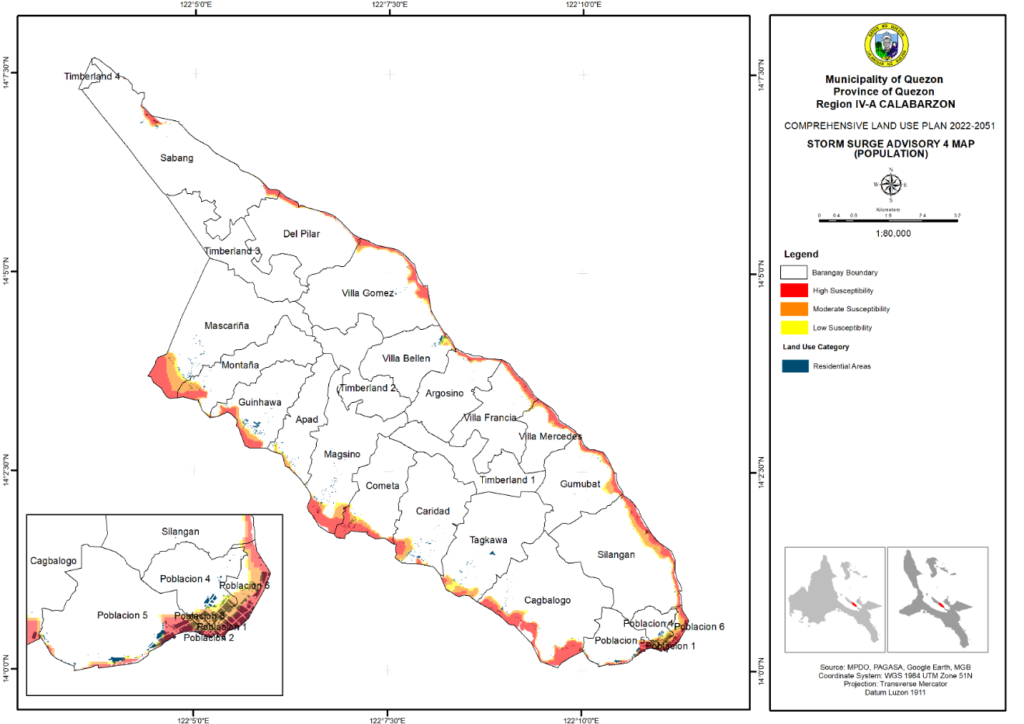
Map 5. Storm Surge Exposure Map of Population in Quezon, Quezon
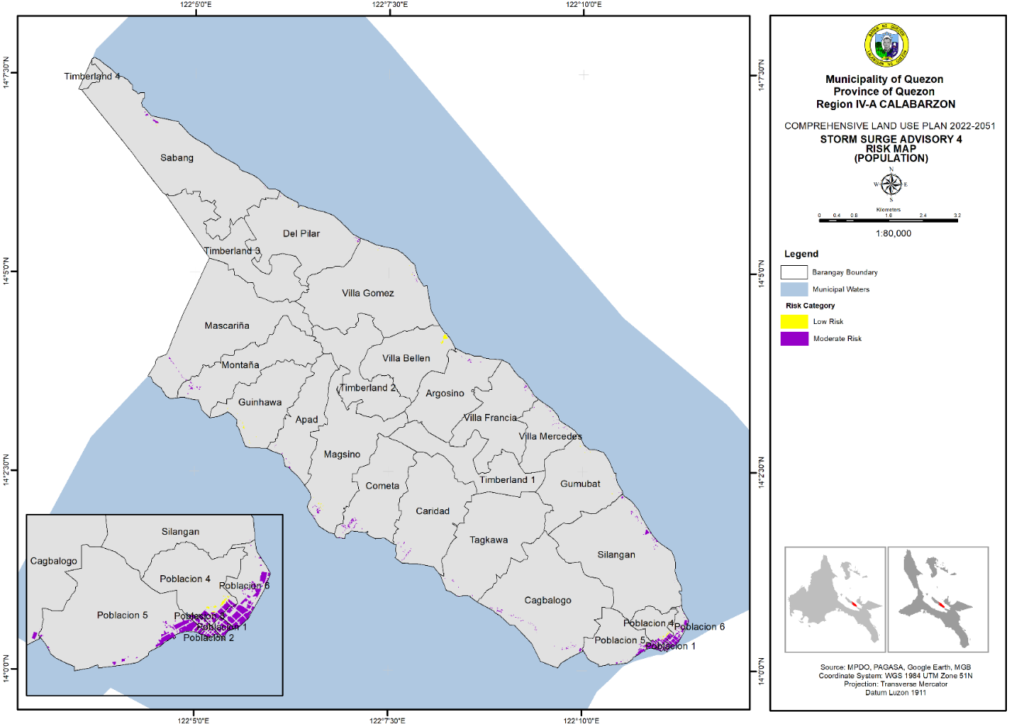
Map 6. Storm Surge Risk Map of Population in Quezon, Quezon
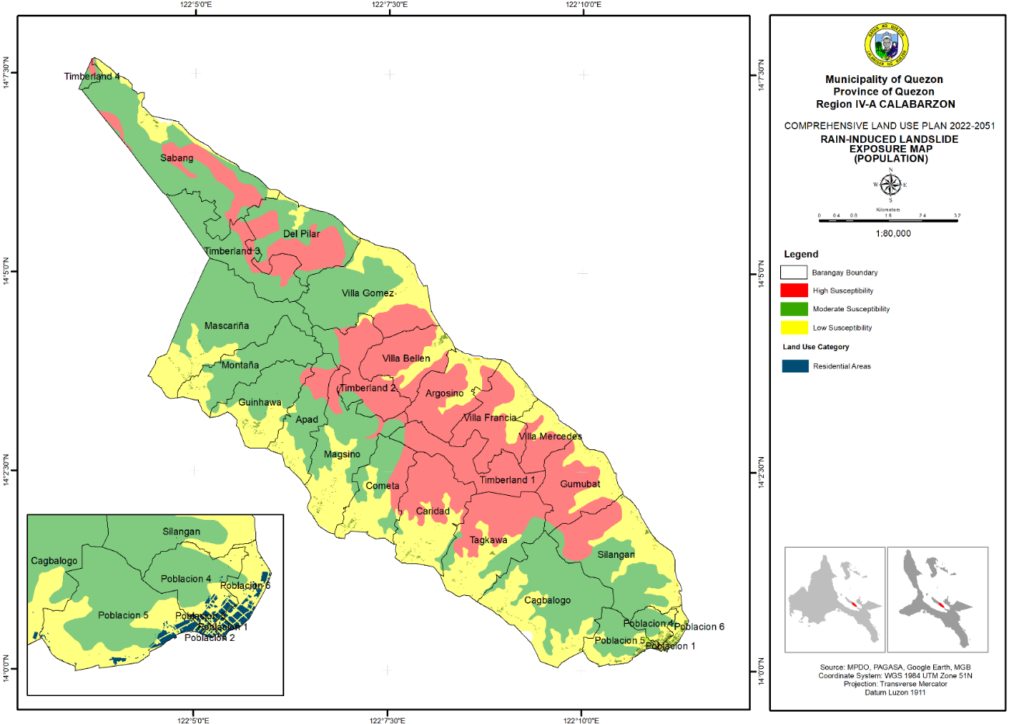
Map 7. Rain-induced Landslide Exposure Map of Population in Quezon, Quezon
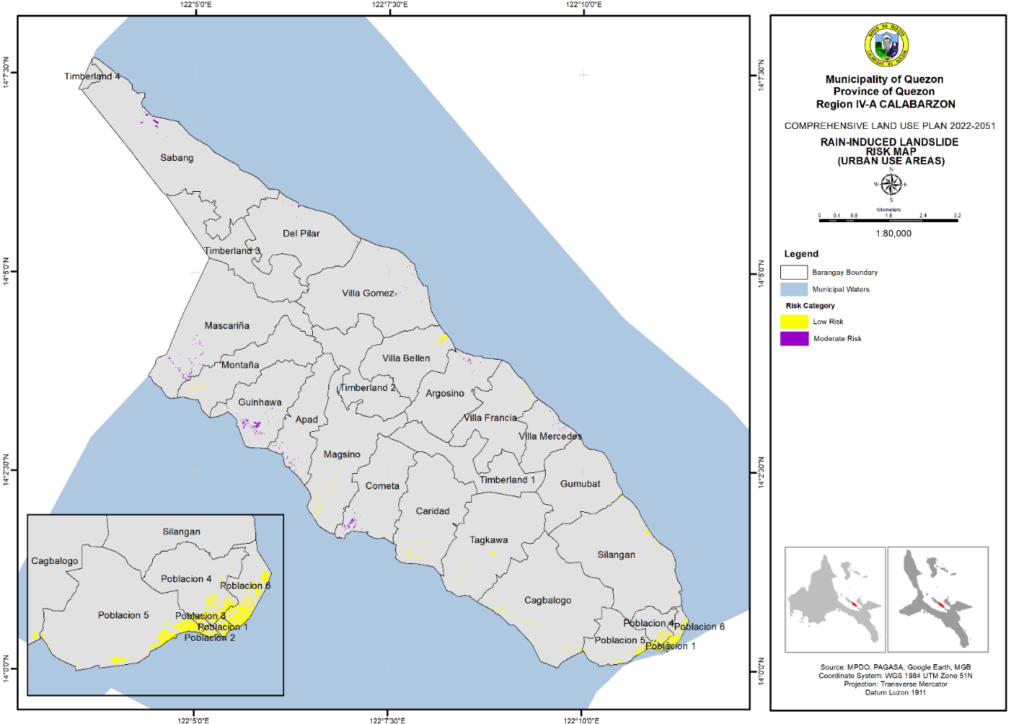
Map 8. Rain-induced Landslide Risk Map of Population in Quezon, Quezon
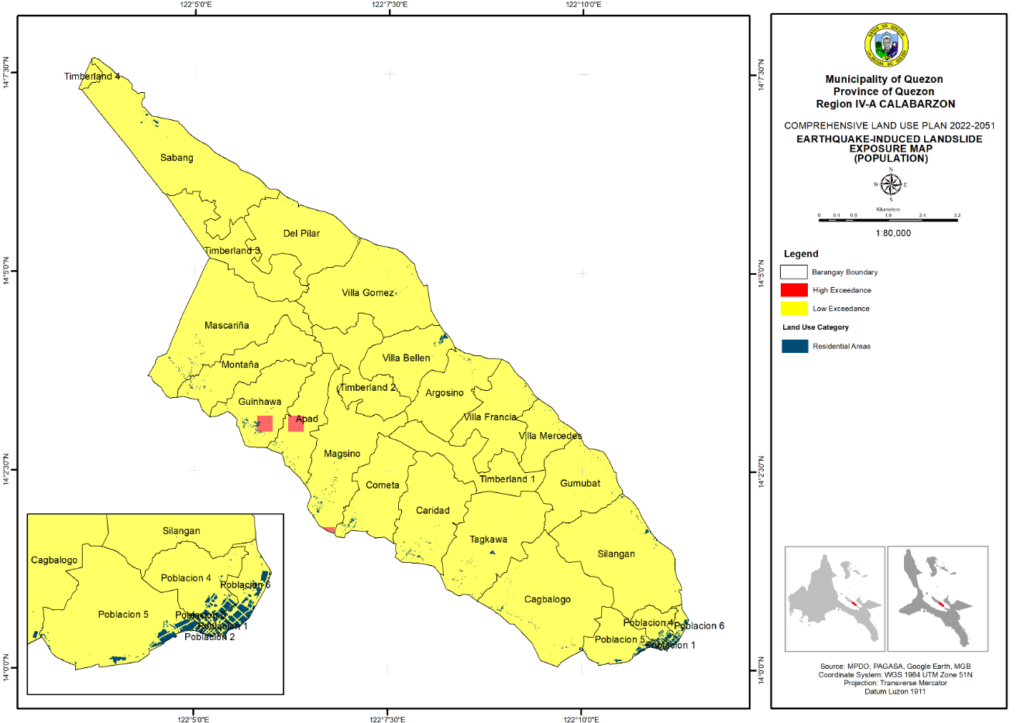
Map 9. Earthquake-induced Landslide Exposure Map of Population in Quezon, Quezon
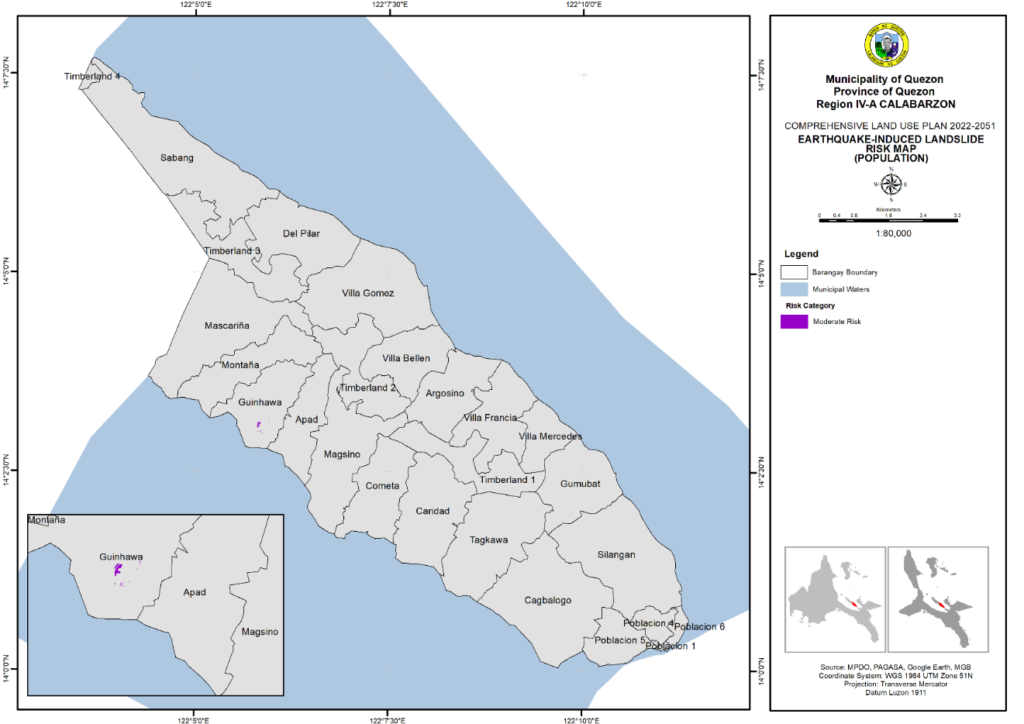
Map 10. Earthquake-induced Landslide Risk Map of Population in Quezon, Quezon
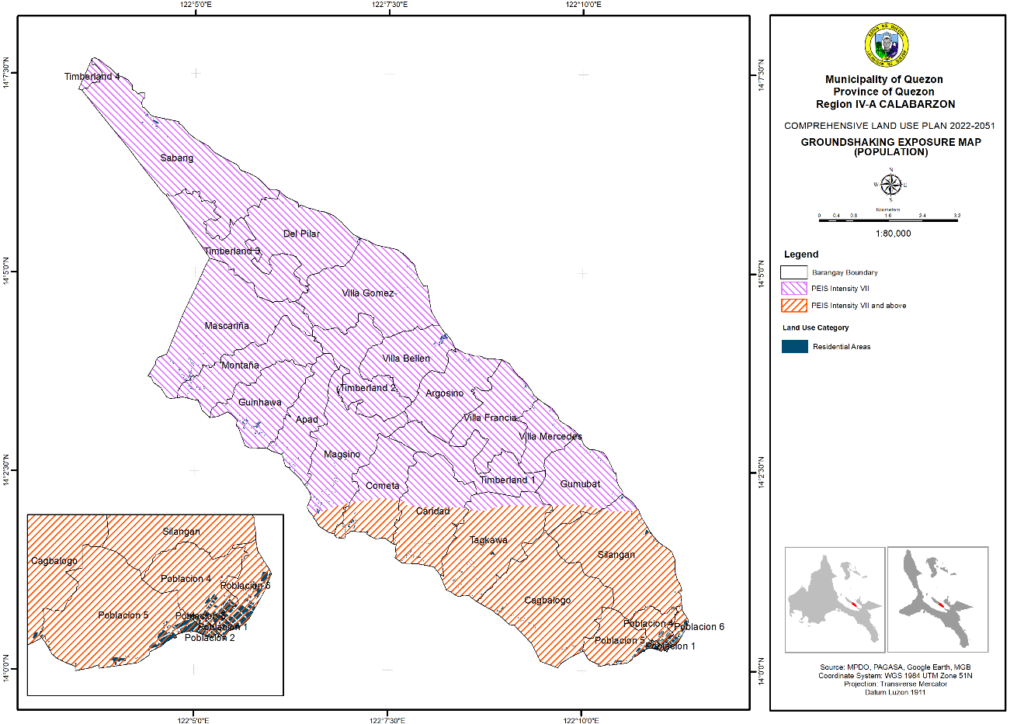
Map 11. Ground Shaking Exposure Map of Population in Quezon, Quezon

Map 12. Ground Shaking Risk Map of Population in Quezon, Quezon
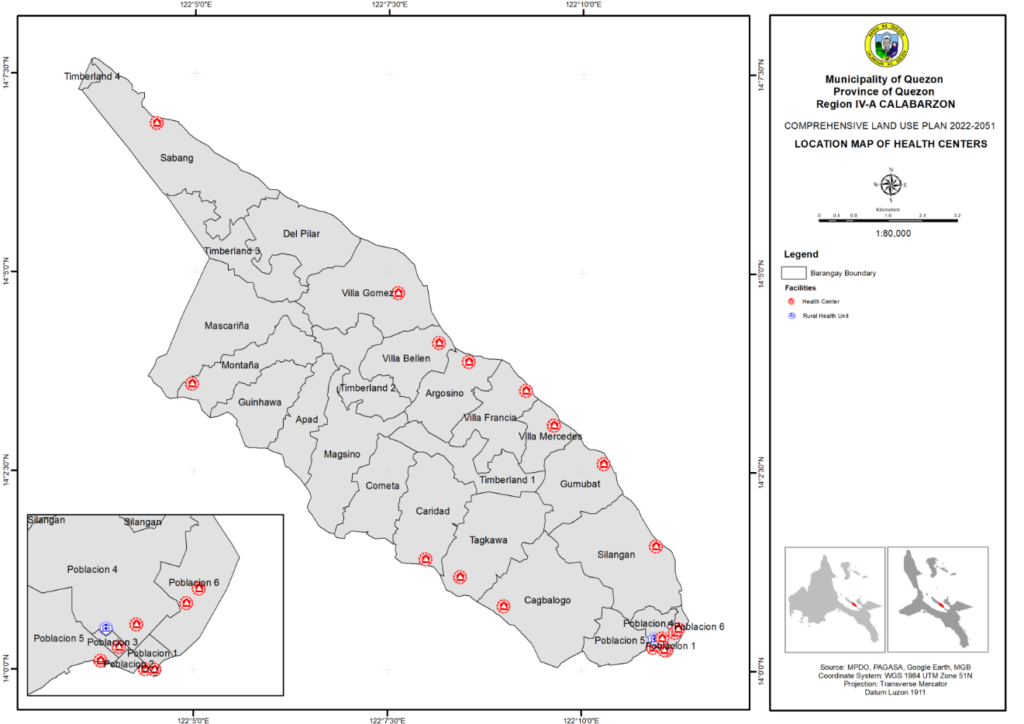
Map 13. Location Map of Health Facilities in Quezon, Quezon
- Location of Communities and Health Facilities
The entire municipality is served by the Rural Health Unit located in Poblacion IV and one (1) Barangay Health Station (BHS) per barangay for the health needs of the residents. There are 19 health personnel including one (1) doctor, one (1) nurse, three (3) midwives, one (1) sanitary inspector, and other staff in the RHU to provide services on medical consultations to minor operations. The health personnel-population ratios are within the standard set by Department of Health. A total of 143 Barangay Health Workers (BHWs) are present in the 24 BHS.
Map 13. Location Map of Health Facilities in Quezon, Quezon
1.4 Risk or hazards (i.e., occurrence of typhoons, landslides, storm surge)
Table RM-1. Hazard Inventory of Quezon, Quezon
| Barangay | Flood | Storm Surge | Rain-induced Landslide | Earthquake- induced Landslide | Ground shaking | Drought | Typhoon |
| Apad | ✓ | ✓ | ✓ | ✓ | ✓ | ✓ | ✓ |
| Argosino | ✓ | ✓ | ✓ | ✓ | ✓ | ✓ | |
| Poblacion I | ✓ | ✓ | ✓ | ✓ | ✓ | ✓ | |
| Poblacion II | ✓ | ✓ | ✓ | ✓ | ✓ | ✓ | |
| Poblacion III | ✓ | ✓ | ✓ | ✓ | ✓ | ✓ | |
| Poblacion IV | ✓ | ✓ | ✓ | ✓ | ✓ | ✓ | |
| Poblacion V | ✓ | ✓ | ✓ | ✓ | ✓ | ✓ | |
| Poblacion VI | ✓ | ✓ | ✓ | ✓ | ✓ | ✓ | |
| Cagbalogo | ✓ | ✓ | ✓ | ✓ | ✓ | ✓ | |
| Caridad | ✓ | ✓ | ✓ | ✓ | ✓ | ✓ | |
| Cometa | ✓ | ✓ | ✓ | ✓ | ✓ | ✓ | |
| Del Pilar | ✓ | ✓ | ✓ | ✓ | ✓ | ✓ | |
| Guinhawa | ✓ | ✓ | ✓ | ✓ | ✓ | ✓ | ✓ |
| Gumubat | ✓ | ✓ | ✓ | ✓ | ✓ | ✓ | |
| Magsino | ✓ | ✓ | ✓ | ✓ | ✓ | ✓ | ✓ |
| Mascariña | ✓ | ✓ | ✓ | ✓ | ✓ | ✓ | |
| Montaña | ✓ | ✓ | ✓ | ✓ | ✓ | ✓ | |
| Sabang | ✓ | ✓ | ✓ | ✓ | ✓ | ||
| Silangan | ✓ | ✓ | ✓ | ✓ | ✓ | ✓ | |
| Tagkawa | ✓ | ✓ | ✓ | ✓ | ✓ | ✓ | |
| Villa Belen | ✓ | ✓ | ✓ | ✓ | ✓ | ✓ | |
| Villa Francia | ✓ | ✓ | ✓ | ✓ | ✓ | ✓ | |
| Villa Gomez | ✓ | ✓ | ✓ | ✓ | ✓ | ✓ | |
| Villa Mercedes | ✓ | ✓ | ✓ | ✓ | ✓ | ✓ |
Source: GIS-derived data, 2021; including ground validation during the CDRA
2. Demographic profile
2.1 Population
The Municipality of Quezon is the seventh (7th) least populous municipality in the province of Quezon with a total population of 15,228 in 2015 and 15,886 in 2020. The male population of 7,844 (51.51%) outnumbered the female population of 7,384 (48.49%) indicating a male-female sex ratio of 106:100.
2.2 Population density
The total land area of the municipality of Quezon is 7,122.20 hectares, which is divided into three (3) areas: urban barangays, rural barangays, and the timberland areas, as shown in Table DE-9. The six rural barangays occupy the largest share of the land with 84.34 percent or 6,006.693 hectares while the urban barangays have the smallest portion with 223.398 hectares or 3.14 percent of the total land area. The timberland areas occupy the remaining 12.52 percent of the municipal land or 892.109 hectares.
Given the land area and the total population of 15,886 inhabitants, the municipality has a population density of two (2) persons per hectare in 2020. It is the same with the Quezon provincial population density of two (2) and but is lower than the CALABARZON region which has 10.
Urban barangays are characterized with having smaller land areas compared with the rural barangays. This results to higher population density ranging from 13 per hectare in Poblacion IV to the densest barangay of 182 persons per hectare in Poblacion I and III. For the rural areas, the highest population density is three (3) persons per hectare in barangays Guinhawa and Villa Mercedes, while the rest of the rural barangays have either one to two (1 or 2) persons per hectare.
Table DE-1. Barangay Population Density of Quezon, Quezon
| Barangay | Population | Area (hectares) | Population Density |
| Urban | |||
| Poblacion I | 505 | 2.781 | 182 |
| Poblacion II | 233 | 1.633 | 143 |
| Poblacion III | 306 | 1.681 | 182 |
| Poblacion IV | 749 | 58.088 | 13 |
| Poblacion V | 1,770 | 133.857 | 13 |
| Poblacion VI | 2,316 | 25.358 | 91 |
| Subtotal | 5,879 | 223.398 | 26 |
| Rural | |||
| Apad | 349 | 202.735 | 2 |
| Argosino | 450 | 245.242 | 2 |
| Cagbalogo | 978 | 514.296 | 2 |
| Caridad | 790 | 337.032 | 2 |
| Cometa | 475 | 256.386 | 2 |
| Del Pilar | 442 | 326.776 | 1 |
| Guinhawa | 815 | 241.576 | 3 |
| Gumubat | 381 | 265.860 | 1 |
| Magsino | 631 | 366.214 | 2 |
| Mascariña | 743 | 491.032 | 2 |
| Montaña | 434 | 261.411 | 2 |
| Sabang | 404 | 563.137 | 1 |
| Silangan | 899 | 480.338 | 2 |
| Tagkawa | 406 | 394.545 | 1 |
| Villa Belen | 468 | 219.434 | 2 |
| Villa Francia | 470 | 255.203 | 2 |
| Villa Gomez | 486 | 457.886 | 1 |
| Villa Mercedes | 386 | 127.590 | 3 |
| Subtotal | 10,007 | 6,006.693 | 2 |
| Timberland | |||
| Timberland 1 | – | 341.527 | – |
| Timberland 2 | – | 305.236 | – |
| Timberland 3 | – | 227.720 | – |
| Timberland 4 | – | 17.626 | – |
| Subtotal | 892.109 | ||
| Total | 15,886 | 7,122.200 | 2 |
Source: Population data from PSA (2020) and Land Area from Quezon, Quezon ELA (2020-2022)
2.3 Population Growth
In 1975, the population and growth rate dropped. After that, the population continued to increase until 2020 with population growth rates ranging from 0.11 to 3.08. The 2020 census data showed the total population of 15,886 with 0.89 population growth rate, which is below the provincial and regional growth rate.
Table DE-2. Historical Population Growth of Quezon, Quezon
| Year | Population | Increase/ Decrease | Growth Rate | ||
| Municipal | Provincial | Regional | |||
| 1918 | 2,627 | – | – | No data | 0.09 |
| 1939 | 4,450 | 1,823 | 2.54 | No data | 0.07 |
| 1948 | 5,346 | 896 | 2.06 | 1.64 | 1.54 |
| 1960 | 8,095 | 2,749 | 3.52 | 3.72 | 3.17 |
| 1970 | 10,604 | 2,509 | 2.74 | 3.99 | 3.78 |
| 1975 | 10,465 | -139 | -0.26 | 2.59 | 3.07 |
| 1980 | 10,734 | 269 | 0.17 | 1.94 | 3.35 |
| 1990 | 11,345 | 611 | 0.56 | 1.97 | 3.27 |
| 1995 | 13,200 | 1,855 | 3.08 | 2.15 | 4.07 |
| 2000 | 14,594 | 1,394 | 2.03 | 1.90 | 3.76 |
| 2007 | 15,011 | 417 | 0.40 | 1.59 | 3.25 |
| 2010 | 15,142 | 131 | 0.29 | 1.70 | 3.07 |
| 2015 | 15,228 | 86 | 0.11 | 1.23 | 2.58 |
| 2020 | 15,886 | 658 | 0.89 | 1.04 | 2.48 |
Source: PSA Censual Years 1939-2020
2.4 Fertility Rate and Death rate
Fertility and mortality rates can be measured using the crude birth rate (CBR) and crude death rate (CDR). Fertility refers to the live births that occur within a population. Fertility varies with the characteristics of the mother such as educational attainment or occupational status.
Crude Birth Rate (CBR) is the most common index of fertility and is computed by dividing the number of births by the midyear population. On the other hand, mortality refers to the occurrence of deaths in a population. Crude Death Rate (CDR), which refers to the number of deaths per 1,000 populations.
For CBR, data showed a fluctuating trend wherein the rate increased from 2017 to 2018 but continuously decreased in 2019 and 2020. Similarly, mortality rate varies every year. The rate of natural increase (RNI) is also provided in the table to show the speed at which the population is increasing at the given period as a result of the interaction of birth and death rate. The highest RNI is in 2018 with 10.44 but decreased up to 5.98 in 2020, which imply that the population of the municipality has grown at the rate of 0.89 percent through natural increase. Table DE- 12 shows the trend of CBRs and CDRs in Quezon, Quezon for the past four years (2017 to 2020).
Crude Birth Rate and Crude Death Rate of Quezon, Quezon
| Period | Rate of Natural Increase | CBR (per 1000) | Increase/ Decrease | CDR (per 1000) | Increase/ Decrease |
| 2017 | – | 13.60 | – | No data | – |
| 2018 | 10.44 | 14.68 | 1.08 | 4.24 | – |
| 2019 | 9.63 | 13.38 | -1.30 | 3.75 | -0.49 |
| 2020 | 5.98 | 11.10 | -2.28 | 5.12 | 1.37 |
Source: Quezon Rural Health Unit, 2021
For five years, the highest recorded Crude Birth Rate (CBR) is 14.68 in 2018 but it decreased to 11.11 in 2020. On the other hand, the Crude Death Rate (CDR) shows a fluctuating pattern with the highest record of 5.12 percent in 2020.
3. Vulnerable Populations
* needing more health care such as youth, Indigenous Peoples, women and children in difficult situations, those living in GIDAs, Urban Poor, Persons with Disability (PWD), and Senior Citizens in specific geographical locations;
4. Environmental Sanitation, Sources and Status of Potable Water
Biodegradable wastes take up the highest share of collected wastes with 42.35% of total wastes, followed by recyclables (30.23%), residual with potential (25.54%), and lastly, special wastes (1.88%). The dumpsite was planned to be completely closed and give way to the development of a 2.2-hectare sanitary landfill in barangay Villa Mercedes.
The population rely on groundwater – it is the water that people drink, the water that grows the food, the water that helps recharge lakes and rivers. In terms of the municipality’s water demand and supply, many households still rely on level I and level II water systems. The municipality is proposing to identify alternative water sources and water harvesting facilities.
Regarding the sanitation status of the municipality, 3,516 households (95.39%) are using sanitary toilets while there are still 170 households (4.61%) with unsanitary toilets. About 68.37% of the households are served with Level I water supply system. The remaining 31.63% are using other supply systems including Level II, Level III, and Doubtful sources. Solid wastes are managed in the one hectare controlled dumpsite which is located in Barangay V.
5. Economic situation
5.1 Major economic activities
Quezon, Quezon has a huge potential for further growth as evident by its good economic performance in recent years. In 2020, the municipality displayed a significant increase in its annual income with a total revenue of Php 81,349,225.72. There has been an annual average growth rate of 8.84 percent since 2016. The booming economy of the municipality is greatly driven by its agriculture, agri-industry, commerce and trade, and tourism.
5.2 People’s sources of income
The municipality has a total land area of 7,122.20 hectares. About 4,983.52 hectares or 69.97 percent of this land are devoted to agriculture. On this account, employment opportunities in the municipality are largely agriculture-based. Farmers, fishermen, and other skilled agricultural and forestry workers make up approximately 43.34 percent of the total workforce.
As an island municipality, fishing and aquaculture production considerably partake in the economic progress of Quezon, Quezon. With approximately 14,931.34 hectares of municipal waters, the people engage both in fishing and cultivation of fishes all year round. Currently, there is an observed increased level of fish export in the municipality.
With the abundant agricultural resources, the locals also ventured into the business of agro-processing. This in turn adds value to their farm produce, increases their income, and creates more employment opportunities. There are actually two prominent agri-industries in the municipality. These are bamboo flute making and coco sugar production. There are, however, other potential ones such as coco vodka or lambanog production.
5.3 Poverty incidence and areas of concentration
The poverty incidence of Quezon, Quezon is 26.2% based on the 2015 PSA Census. However, there is no available data per specific area or barangay.
6. Social situation:
6.1 Education
Preparatory education is accessible through child development centers or day care centers in each barangay or through some elementary schools. The municipality of Quezon also offers elementary and secondary education through the 16 schools present in the municipality. There is no tertiary or vocational school in the municipality, hence, students that seeks to continue to higher education must go to the nearest tertiary school in Alabat or travel across to Lucena City and other neighboring Quezon municipalities and provinces. Additionally, there are no school that caters to children with special needs or special education (SPED). On the other hand, an elementary school is proposed to be constructed in barangay Silangan and high school in Cagbalogo.
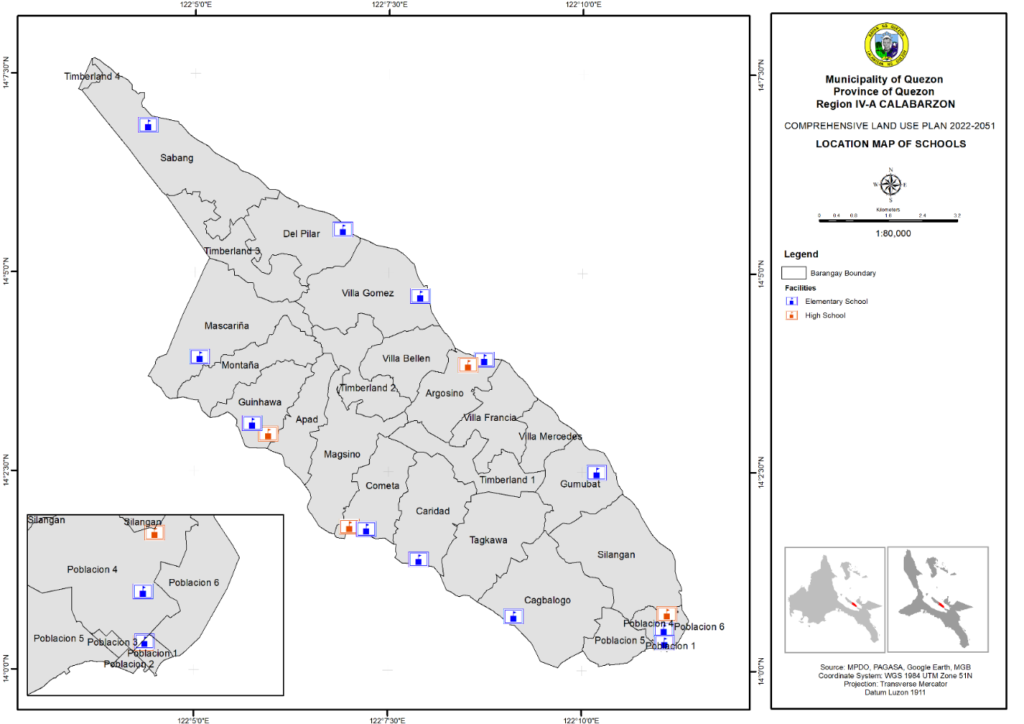
Map 14. Location Map of Educational Facilities in Quezon, Quezon
6.2 Peace and order
The existing protective facilities in the municipality of Quezon are the PNP station, custodial facility, and BFP headquarters which are all located within the municipal compound in Poblacion IV. Currently, there are 22 police officers resulting to a police-population ratio of 1:722, which meets the minimum standard of 1:1,000 personnel. On the other hand, the BFP has eight (8) fire brigades bringing about a fireman-population ratio of 1:1,986, which is within the ideal ratio of 1:2,000. Supporting the police force in terms of maintenance of peace and order, there are 199 barangay security forces or barangay tanods.
7. Sources of Food
At present, the municipality of Quezon is able to efficiently meet the food requirements of the people. Moreover, prices of farm and fishery produce are relatively cheaper. However, the municipality still engages in importing due low vegetable crop production. Agriculture and fishery are critical components for the economic growth and development as well as the sustainable production of food in the municipality of Quezon.
8. Support Facilities
The municipality of Quezon has two (2) transportation linkages: inter-connectivity by sea transport, and intra-connectivity by land transportation. The municipality has a total of 23.7 kilometers of road networks, composed of national (15.474 kilometers), municipal (7.22 kilometers) and barangays (1 kilometer) roads.
The national and barangay roads are in good condition and is characterized by a free traffic flow, as for the municipal roads: * A. Bonifacio, C.M. Recto, Oliveros, Harrison, Villapando, Roxas St, Enero, Olivera, Osmeńa, J. Genciana, Magsaysay, Militante, and Bayan streets are in poor condition. Residents primarily use tricycles, motorcycles, and bicycles as modes of transportation within the island. There are 48 tricycles registered in the municipality.
For interconnectivity, the municipality relies on sea transportation. The Quezon port is located in barangay Poblacion II. Currently, there are only two (2) service providers that offer transportation to and from the municipality. The Roma Point Bridge is currently being constructed, the bridge will connect the municipality of Perez and the Island of Alabat to the mainland province via Lopez, Quezon.
The main electricity provider in Perez is the Quezon Electric Cooperative, Inc. (QUEZELCO I). All households in the municipality have electric connectivity, however, power outages are frequent. In terms of number of connections and consumptions, there has been an increase in the number of connections and avarage consumption in residential, commercial, and public buidlings, and a decrease in public streetlights.
There are only few communication facilities in Quezon. There is no postal office, telephone service provider, print media facility, and public calling stations. Internet connectivity is limited with having only two (2) cellular towers and mainly located in the barangay Poblacion V. Cable TV and CCTV are present and are utilized by residents.
9. Ethnicity and Religion
There are no available data on the ethnicities present in the municipality. However, as part of the Southern Tagalog municipalities, majority of the population predominantly speaks Tagalog. According to the Municipal Socio-Economic Profile (2014), aside from the native Tagalogs, there are also Bicolanos, a few Cebuanos and Chinese who established permanent residence in Quezon, Quezon. It can also be noted that there are three to four families of nomadic IPs living in the municipality, particularly in barangay Del Pilar, but their main group is based in Alabat.
There are no available data on the number of religious affiliations in the municipality; though, the Municipal Socio-Economic Profile (2014) specifies that while most of the residents are Roman Catholics, there are also members of Iglesia ni Kristo, Protestants, Jehova’s Witnesses, and bible study groups.
10. Political subdivision, administrative jurisdiction, income class
The land area of the municipality of Quezon is 7,122 hectares based on the cadastral map, composed of 24 barangays (Map RM-2). There are six urban barangays also as the urban barangays: Poblacion I, Poblacion II, Poblacion III, Poblacion IV, Poblacion V, and Poblacion VI. The rural barangays are.located in the Lamon Bay area are barangays Cagbalogo, Tagkawa, Caridad, Cometa, Magsino, Apad, Guinhawa, Montaña, and Mascariña while on the Pacific side are barangays Silangan, Gumubat, Villa Mercedes, Villa Francia, Argosino, Villa Belen, Villa Gomez, Del Pilar and Sabang.